Drag is usually considered to be divided into the minimum drag, frequently called zero lift drag, CD0, and the drag due to lift. The drag due to lift is further broken up into induced drag and additional profile drag. The induced drag is a function of the wing spanload only, and is independent of the details of the particular airfoil used in the wing. The additional profile drag is associated with the airfoil used in the wing. At low lift coefficients this drag should be small, only becoming important as flow separation starts to develop on the airfoil section. The additional profile drag becomes large as wing stall is approached.
Wing performance is evaluated based on the ability to obtain a high
value of the lift to drag ratio, (L/D), relative to the maximum
possible for that planform, and the ability to achieve a high maximum
lift coefficient. Essentially, the wing should be designed to allow
the airfoil to achieve its full performance. Recalling that in potential
flow theory a
two-dimensional airfoil has no drag due to lift, the maximum
performance should occur by adding the induced drag, assuming
an elliptic spanload, to the zero lift drag (this would be known
as the 100% suction polar, since the airfoil section has no additional
profile drag due to lift, and is thus achieving 100% of the leading
edge suction required to eliminate the drag force in a two-dimensional
flow), DCD = CL2/(![]() AR). At the other extreme,
the worst case occurs when
the airfoil fails to produce any efficient lift, such that the only
force is normal to the surface and there is no edge or suction force
(0% leading edge suction). In this case the entire lifting force on
the wing is the normal force, and the polar can be determined by
resolving that force into lift and drag components
{
AR). At the other extreme,
the worst case occurs when
the airfoil fails to produce any efficient lift, such that the only
force is normal to the surface and there is no edge or suction force
(0% leading edge suction). In this case the entire lifting force on
the wing is the normal force, and the polar can be determined by
resolving that force into lift and drag components
{![]() CD = CL tan(a -
a0)}.
In any experimental evaluation of wing performance both the 100% and 0%
polars should be constructed, and used to establish bounds on the
experimental polar. For unswept wings, the span efficiency, e,
predicted based on lifting line analysis should also be contained
on the drag polar estimate.
CD = CL tan(a -
a0)}.
In any experimental evaluation of wing performance both the 100% and 0%
polars should be constructed, and used to establish bounds on the
experimental polar. For unswept wings, the span efficiency, e,
predicted based on lifting line analysis should also be contained
on the drag polar estimate.
It is difficult to identify the initial flow breakdown using the drag polar. A better way of examining wing performance is available by plotting axial force as a function of normal force. In this plot the axial force should initially decrease. When the airfoil section starts to loose leading edge suction (in essence a failure to fully enforce the Kutta condition, leading to less circulation than theoretically required) the data should display a sharp "break." This can be used to identify the initial loss of airfoil performance. This illustrates the loss of aerodynamic efficiency due to flow separation.
The stability of the wing is determined by measuring the pitching moment characteristics and examining the slope of the pitching moment with respect to angle of attack and lift coefficient. At low angles of attack the curve should be linear, and the slope of the curve with respect to the lift coefficient can be used to determine the aerodynamic center of the wing. The behavior of the pitching moment curve at wing stall and the "break" of the lift curve with angle of attack play a major role in determining the aircraft flight characteristics at stall.
Stall characteristics are important. The pilot should have a warning that the stall is about to occur. At stall, the loss of lift should be gradual and the airplane should remain controllable. Stall is caused by flow separation on the wing. The characteristics of the stall will be associated with the initial flow separation location and the manner in which the separation develops as the angle of attack is increased. Mild wing stall is associated with a separation that occurs at the upper surface trailing edge, which then moves forward with increasing angle of attack in a systematic, smooth fashion. In addition, this type of stall will lead to flow unsteadiness that the pilot will sense as a buffeting of the airplane prior to stall. This can frequently be observed as model vibration during wind tunnel tests. For the aircraft to remain controllable, the ailerons should remain effective at stall. This can be a problem, and is a key consideration in aerodynamic wing design.
Abrupt stall characteristics are the result of a sudden separation at the wing leading edge, leading to separation over the entire upper surface of the wing. This type of stall provides little warning to the pilot. The loss of lift is large due to the massive flow separation. Wing flow separation characteristics can be examined directly using surface flow visualization techniques, typically tufts, to observe the separation pattern, or inferred by examination of the force and moment characteristics. The airfoil section and wing planform, camber, and twist, determine the stall characteristics.
In addition to the lift characteristics, the character of the pitching moment must also be carefully examined at wing stall. It is quite likely that the pitching moment curve slope will change dramatically at stall. If the slope suddenly becomes unstable, the pitching moment behavior is termed an "unstable break," and the airplane will tend to pitch nose up at stall. At best this is undesirable, and if insufficient control authority is available to bring the nose down the airplane will suffer a departure from controlled flight, possibly leading to a spin. If the pitching moment curve has a "stable break" the wing design is likely to be acceptable from a stability and control standpoint. For complete aircraft many factors other than the isolated wing characteristics influence the pitching moment behavior near stall.
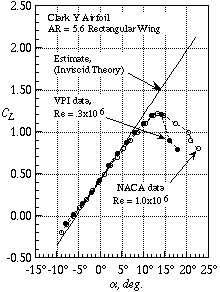
Lift, drag, and pitching moment examples illustrating these characteristics are provided in Figure 1. Additional information on wing aerodynamics is contained in your aerodynamics text, Bertin (Ref. 1). The book by Abbott and von Doenhoff (Ref. 2) not only contains a wealth of information on airfoils, but also information on wing characteristics.

Figure 1a. Lift Coefficient
Figure 1b. Pitching moment
Figure 1c. Drag polar
Figure 1. Typical wind tunnel force and moment results plots
Key issues in testing a wing in a wind tunnel to predict full scale flight performance are the problem of maintaining Reynolds number similarity, accounting for possible flow nonuniformities in the wind tunnel, and making corrections to the wind tunnel data to account for the effects of the wind tunnel walls and the effect of the model support system on the measurements. In most cases the full scale flight conditions will result in turbulent flow. In wind tunnels the low Reynolds number may result in a significant amount of laminar flow. To achieve a boundary layer similar to the one that exists at the flight Reynolds number, the boundary layer is frequently "tripped" to force transition to turbulent flow. A discussion of forcing boundary layer transition by "tripping" (known as "fixing," because the boundary layer transition location is known to be at a specified fixed location) is provided in Appendix 3.
The flow in the wind tunnel is not perfectly uniform. To account for flow angularity, the experimental data taken in the test must be corrected after the test (this is sometimes built into the data reduction systems for modern online real time data reduction systems). The correction depends on the wind tunnel user knowing the flow angularity. Other wind tunnel corrections are also discussed in Appendix 3, which is based on the book by Barlow, Rae and Pope, Ref. 3.
Cavitation: This occurs most frequently on propellers. However, it can also occur on high performance hydrofoils. Whenever the ambient pressure at a point in the liquid equals or falls below the vapor pressure, the liquid will begin to "boil" and cavitation bubbles will appear. The bubbles move to areas of higher pressure and collapse. If they collapse while in contract with the propeller, the surface will become eroded. The accumulation of bubbles on the propeller surface will form a vapor cavity. Since the water is no longer in contact with the blade, this part of the blade will not produce any thrust and the propeller performance will be reduced. Similarly, lift is lost on a hydrofoil. The effects of cavitation on the propeller are thus reduced thrust and efficiency, and erosion of the propeller surface. Furthermore, noise is generated by the collapse of cavitation bubbles.
A typical sequence in the development of cavitation on a propeller begins at a tip vortex and spreads down the leading edge on the back (or suction side) of the propeller to the root of the blade. It then progresses along the back surface to the trailing edge until the whole back surface is enveloped by a cavity. A cone vortex is also formed at the end of the hub. At this time the thrust is wholly generated by the positive pressure acting on the face of the propeller.
Operation under cavitating conditions should be avoided, and in the design of a propeller this has to be checked. Most of the information on the cavitation characteristics of propellers is obtained from model tests. They are typically conducted in cavitation tunnels where the ambient pressure can be reduced to properly scale the cavitation number.
Ventilation: Any surface-piercing foil system tends to suffer from air entrainment. This is generally known as ventilation and also called entry. Ventilation by a hydrofoil is usually an unmitigated nuisance. It arises from the fact that the hydrodynamic pressure over the top of the foil is considerably below atmospheric pressure, so that any air that is offered the chance of being sucked into this region will rush in immediately. The result is a sudden and severe loss of lift. In bad cases the effect is as if the foil had broken off. If the supply of air is limited, or if it rushes in for only a brief moment of time, a single transient bubble forms on the dorsal surface of the foil and is shed into the slipstream. The effect is as if the ship had run over a rut. A much more serious situation occurs when air can enter continuously. This has often posed a problem in the development of a foil mounted on a hollow strut, or a variable-incidence foil driven by a push-pull rod, because these arrangements tend to provide a path for the air. It is endemic in all surface-piercing foils by their very nature, because air can leak in down the surface of the foil itself. Low fences or screens running chordwise on struts and foils are used to stop this leakage.

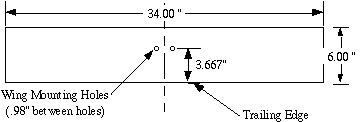
Figure 2. Wing planform used for experimental examination of wing characteristics
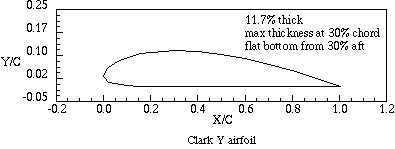
The Clark Y airfoil is named after Col. Virginius E. Clark, who designed many airfoils around the time of World War I. The Clark Y was designed in 1922. One of its distinguishing features is its flat lower surface from 30% chord to the trailing edge. This airfoil was widely used, but has been superseded by improved airfoils today. This is the airfoil used in the wing to be tested in this lab.
Tabulated coordinates for the Clark Y airfoil, from Riegels (Ref 5), are given in Table 1. The airfoil section is shown in Figure 3. This airfoil was tested extensively by the NACA, and numerous reports are available. One series of tests was conducted in the NACA full scale tunnel at Langley in Hampton, Virginia. Those tests are described by Silverstein in Ref. 6. That report also describes the NACA methods for test corrections, including aspect ratio effects. Results were also presented by Warner in Ref. 7 (pages 158-224 provide a wealth of information).
Table 1. Clark Y Airfoil Coordinates (Ref. 5)
     x/c      y/c upper    y/c lower
   0.0000      0.0350       0.0350
   0.0125      0.0545       0.0193
   0.0250      0.0650       0.0147
   0.0500      0.0790       0.0093
   0.0750      0.0885       0.0063
   0.1000      0.0960       0.0042
   0.1500      0.1068       0.0015
   0.2000      0.1136       0.0003
   0.3000      0.1170       0.0000
   0.4000      0.1140       0.0000
   0.5000      0.1052       0.0000
   0.6000      0.0915       0.0000
   0.7000      0.0735       0.0000
   0.8000      0.0522       0.0000
   0.9000      0.0280       0.0000
   0.9500      0.0149       0.0000
   1.0000      0.0012       0.0000

Figure 3. Standard Clark Y airfoil shape (other thicknesses are sometimes used).
In a commercial aerodynamic test, one of the major items that must be prepared ahead of time is a pretest report (which in your case will be contained in the preparation sheet of your logbook). This document provides not only a run schedule, but includes specific estimates of the items that are being measured. A test would not be allowed to begin without such a report being filed. As the test proceeds, data is plotted over the pretest estimates as it is collected. This allows measurement and test problems to be detected at the earliest possible opportunity. The goal of the preparation for experiment 7 is the generation of just such a report. To prepare for this experiment you will need to:
(a) Carefully read this chapter of the manual and appendix 3. It is important to be familiar with the descriptions of the measurement techniques and experimental set up. Check out the model support pictures.
(b) Communicate with the other members of your team. Your team members and their contact information will be listed on your individual schedule, handed to you during the introductory lab period. Organize preparation for the first lab period - the team will need to find copies of references 1 and 6 as well as relevant material from the other references (particularly reference 3 which is on reserve in the library).
(c) Visit the Stability Wind Tunnel before your test. Days and times when you can visit the Stability Wind Tunnel before your test will be posted on the course home page. This is so your team can examine and measure the facility and model, take photos, learn about the data-acquisition system, and measure any parameters they will need for their pretest planning and report. The Wind Tunnel engineer (Mr. Bill Oetjens) will be on hand to answer questions. It is important that your team come with prepared with list of information they need to collect for the pretest-report to be completed.
(e) Pick a flow speed for your test
(f) Define the test data requirements
(g) Plan a run schedule
(h) Make Pretest Estimates of the Aerodynamic Characteristics of the Wing Model.
The zero lift drag should be estimated using flat plate skin
friction formulas.
For incompressible laminar flow:
![]()
For incompressible turbulent flow the Schlicting formula can be used, and is:
![]()
(note that the log in the denominator refers to a base 10 log).
Additional form drag can be estimated using a form factor. Many are available,
all based on correlation with data. The factor recommended by Hoerner, Ref. 8, is
![]()
where t/c is the airfoil maximum thickness ratio. To estimate CD0, the form
factor is used with the skin friction estimate:
![]()
Note that formulas for CF refer to one side of the wing only. The ratio of
wetted area to reference area (approximately two for this test) is used to include
all the area subjected to skin friction. You will need to perform estimates of CD0
with the transition strip on and off (and thus present two numbers,
or lines on the plots)
 | |
| AR | - aspect ratio |
| - Prandtl-Glauert compressibility factor, | |
| - sweep of the maximum thickness line on the wing | |
(i) Prepare preliminary uncertainty estimates
(j) Make a test plan
(k) Present the above information to your TA as a team pretest report