W. J. Devenport and S.R. Edwards
Last revised January 12th, 2007
The purpose of this lab period is to introduce you to computer based measurement systems. You will get to install and use a digital data acquisition system (DAQ) to the USB port of a computer. You will get detailed instruction on programming in LabView. LabView is a graphical programming language that is used worldwide for making and analyzing digital measurements, as well as controlling large test and measurement systems. Using LabView you will program a DAQ to make measurements, and through those measurements you will observe some of their capabilities and limitations.
As preparation for this lab you will need to:
During the lab period you work in groups of two or three under the direction and guidance of an instructor. You are expected to take notes (electronic or paper) to record your experiences. It is important you save your notes as you will need to build on them in subsequent lab periods. To perform this lab successfully you will need to have a general understanding of what a DAQ system does, how its capabilities are defined as well as the terminology that is used to describe digital measurements and the systems that make them. These basic concepts are described below. In addition to this material you will be given specific instructions during lab.
Making measurements with a computer can bring tremendous processing power, flexibility and speed to an experiment. For a computer, the act of making a measurement consists of converting an analogue signal, whose voltage represents a physical quantity we want to determine, into a binary number representing the value of that voltage. This process is termed 'analogue to digital conversion' and is accomplished using a device with the unsurprising name of an 'analogue to digital converter' or A/D converters.
The reverse process - turning a number determined as the result of some algorithm in the computer - into a voltage proportional to that number is termed 'digital to analogue conversion'. D/A converters allow a computer to provide input to an experiment (such as an excitation) and thus exert control.
These two types of devices are often packaged together in single units referred to as 'DAQ Cards', 'DAQ devices', 'Data Acquisition Systems', 'Digitizers' or just 'A/D Converters' (yes, that's ambiguous). These units appear in a range of forms, capabilities, types and prices. One common form is a card that slides into a spare slot in your laptop or desktop.
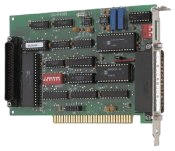
The card shown here (a Measurement Computing CIA-DAS08) can be bought of the web for about $350. You might reasonably wonder how you would connect any cable to such a card. Usually the manufacturer supplies (at extra charge) a connector that fits to the outside of the card, a cable, and a panel into which you can plug a cable. A second common type, often seen in high end systems, is a stand-alone rack that connects to the computer through a communications cable, such as Firewire or Ethernet.

The system shown is a VXI system (there are several others) and will set you back about $10k for each of the cards, and about another $5k for the box they sit in (plus the cables and connection strip you see). An important advantage of this type of system is that it can be easily switched between computers, and is not dependent on a specific computer architecture. A particularly recent development that incorporates this flexibility but in a more streamlined fashion, is small data acquisition systems that simply sit at the end of a USB cable, looking rather like a USB hub.
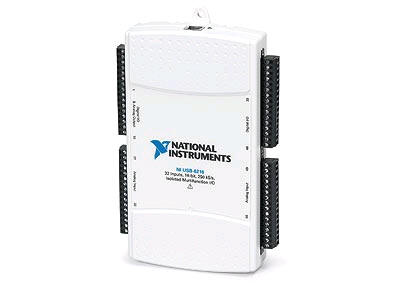
The picture shows one such device - a National Instruments USB 6211 (~$700). Connections are made using the small screw terminals that run up and down the two sides. The USB cable plugs in the top. This is the particular DAQ device you will be using in lab. Despite its smaller size (which is really a testament to the advance of technology) this device has all the same basic functionality seen in the vast bulk of computer measurement systems.
An important goal of instrumentation lab is to give you hands-on experience of using an A/D converter. Specifically, you will get to exploit its measurement and control capabilities (and the associated analysis capabilities of the computer) to greatly enhance the engineering value of the structural dynamics testing performed in experiment 6. To exploit those capabilities you have to know what they are, and that is the purpose of this document.
2.1 Sampling and the Nyquist Criterion

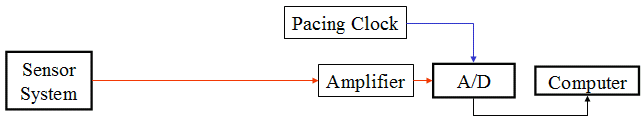
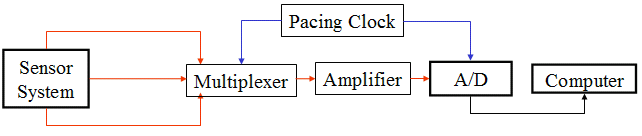
The figure shows the minimal block diagram for a computer based measurement system. A sensor produces a voltage signal v that varies with time t that we wish to measure. The signal is fed to an A/D chip that measures it at regular intervals, and sends the measurement in the form of a series of binary numbers to the computer. To keep the measurement intervals regular a pacing clock is used. (Note that, as we build this block diagram, everything that appears between the sensor system and the computer is integrated into the DAQ device.)
It may come as no surprise that this kind of system can make measurements pretty fast. The USB 6211 can sample (i.e. measure) a signal up to 250,000 times a second, which is fairly good. However, systems that can handle 1,000,000 or even 1,000,000,000 samples per second are easy to find. With all this capability it is common to want to use the DAQ to measure the actual time history of a signal, as opposed to just its value at one time. Having the time history enables us to determine such things as the average and standard deviation (and any other statistics) as well as the frequency content. With two time-history measurements simultaneously we can infer cross-spectra and correlations. This kind of information has obvious engineering value, whether we are trying to understand the origin of velocity fluctuations sensed in the wake of a circular cylinder or the nature of vibrations generated in the structure of a rocket and their correlation with the aerodynamic loads.
If we want to measure the time series of a signal we have to measure it fast enough to define that time series. Consider the two examples shown in the figure below, which show two sets of samples (marked by the points) of a continuous voltage signal (the gray line).
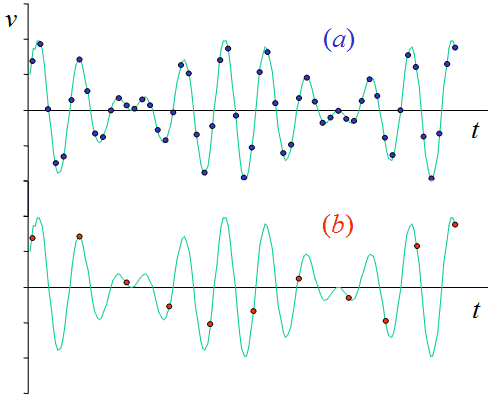
In case (a) the sampling frequency (the number of samples taken per second) appears to be enough to define all the important features of the signal. In case (b) the sampling rate is too low, and the measured points define a waveform that appears quite different than the original signal (even though each individual sample is accurately measured). This problem is referred to as aliasing, and we would say that in case (b) the 'signal is aliased'. Note that aliasing causes errors whenever we want to use the samples to determine something about the time sequence itself, such as the frequency content of the signal. It doesn't cause errors in statistics, like the mean or standard deviation.
So how fast do we have to sample to avoid aliasing? The answer is that we have to sample at a rate that is at least twice the highest frequency in the signal. This important condition is referred to as the Nyquist Criterion. The frequency that is half the sampling rate (i.e. the maximum permissible frequency in the signal if we are to avoid aliasing) is referred to as the Nyquist Frequency.
Note that the sampling rate of the DAQ device can usually be set to pretty much any value below its maximum, according to the wishes of the engineer. This selection is generally made in the operating software running on the computer.
2.2 Range and Resolution
Like any system the A/D chip in the above block diagram has some limits.
There has to be a maximum voltage it can measure, and there has to be a maximum
size to the numbers it can generate at its output. These effectively limit the
range and resolution of any measurements made. A/D chips (including that in the
the USB 6211) usually have a range of ±10V.
The numbers output by the A/D are in the form of binary integers. The number of digits (technically bits) in such an integer defines its maximum value, as well as the number of different values that can be represented. For example, a 3-digit decimal number has a maximum value of 999 (that is 103-1), a minimum value of 0, and thus can be used to define 103 different values. In the same way, an 8-bit binary number has a maximum value of 11111111 (that is 28-1), a minimum of 0, and thus defines 28 (or 256) different values.
Consider then the USB 6211. This contains a 16-bit A/D converter that can thus output numbers with 216 = 65536 different values. Given that the input range of this device is ±10V, its output increments by 1 when the input voltage increases by 20/65536=0.000305V=0.3mV. This is the resolution of the USB-6211 (the smallest voltage change that it can detect). In other words the resolution of an A/D converter is its total range divided by two raised to the power of the number of bits it has.
Most A/D converters are usually either 8-bit, 12-bit, 14-bit or 16-bit. Obviously the more bits, the finer the resolution and the more accurate the device is. However, more bits usually cost more money and reduce the maximum sampling rate.
The 16-bit resolution of the USB 6211 is good. It means that when you use it to make a measurement of a signal say around 8V that measurement is made to an resolution of about 5 significant figures, generally better than one can get with any analogue instrument or meter (and remember it might be making 250,000 of these a second). However, this doesn't mean the resolution will always be sufficient. A common engineering sensor is a strain gage (often used to measure strains, forces and moments). It would not be unusual for a strain gage to put out a voltage that varied between -2mV and +2mV, depending on the strain. Measuring that output with a resolution of 0.3mV would likely be a waste of time.
This problem (that results from the miss-match of the range of the sensor output and the A/D input) is solved by adding an amplifier to magnify the incoming voltage signal.
This solution is needed so often that DAQ devices generally come with an on-board amplifier that can be programmed from the computer. The USB-6211 has such an amplifier that can be programmed to magnify the incoming voltage signal by a factor of 1, 2, 10, or 50, making the effective range of the A/D equal to ±10, ±5, ±1, or ±0.2V. For the strain gage problem we could use a gain of 50, and thereby improve our resolution to 0.006mV.
One subtle but potentially important issue is that resolution is not the same as accuracy. Just because an A/D converter can distinguish small changes in voltage levels doesn't mean that it reads those levels accurately. Check the absolute accuracy of the USB-6211 as listed on its data sheet, and decide for yourself if it would be suitable for the strain gage application.
2.3 Measuring Multiple Signals
As engineers we are often interested in the relationship between different
physical quantities; the force exciting a structural system and the displacement
it produces; the speed of a wind gust and the attitude of an airplane; the
pressure fluctuation on a submarine hull and the noise heard far away. To
experimentally reveal these relationships it is often necessary to measure
multiple sensor signals. The DAQ system described to this point measures only a
single signal however, but can be extended to measure multiple signals using a
device known as a multiplexer, or MUX.
The multiplexer is essentially an analogue switch that creates a composite signal containing short bursts of each signal to be measured, as illustrated below.
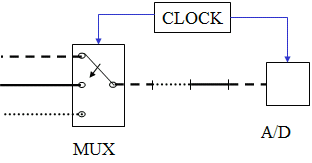
The switching of the multiplexer is synchronized with the A/D converter so that one sample of each signal is taken in sequence. 8 and 16-channel multiplexers (allowing the measurement of up to 8 or 16 signals) are common. The USB-6211 contains a 16 channel MUX. Note that, with a multiplexer in place, the sampling rate for each channel is now the total sampling rate divided by the number of channels.
The multiplexer also adds one other feature to the DAQ system. It gives you the option of operating in single-ended or differential mode. In single-ended mode one of the two wires carrying each signal is connected to ground, and the other to the multiplexer. This way each signal is measured relative to the ground voltage. This can cause problems if neither of the lines from a sensor is a ground. It can also cause noise, as connecting the ground lines of a bunch of sensors together can make them susceptible to interference. In differential mode the multiplexer senses the the voltages of the two wires carrying each signal separately, and outputs their difference. There is no assumption about ground lines and noise contamination is much less of a problem. The only downside is that each signal then occupies two channels of the multiplexer, halving the number of signals that can be measured. As you would expect, the USB-6211 can measure 16 channels in single-ended mode and 8 in differential mode.
If you are following the details you will have noticed that the multiplexer doesn't actually allow for truly simultaneous measurements of multiple signals. Instead the signals are measured sequentially, in rotation. This means, for example, that corresponding samples of two signals measured with the USB-6211 are actually taken 1/250000th of a second apart. This may not sound like much of a problem and, indeed, in many cases it is not. However, this can be an issue in high frequency applications, or applications where short transients are important. The solution here is to add another component to the DAQ as shown in the figure.

Sample and hold (S/H) circuits are used to ensure truly simultaneous sampling of multiple signals. These sit in front of the multiplexer and, on command from the the pacing clock, freeze at their outputs the voltage sensed at their inputs. The multiplexer and A/D chip then measure these simultaneously frozen signals in sequence, and thus in effect make a simultaneous measurement. Note that the USB-6211 does not have sample and hold capability.
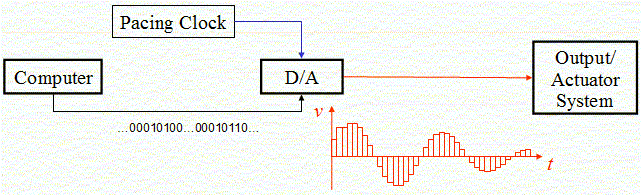
The minimal block diagram for a D/A converter system is the same as that for the A/D converter, but with the direction of information flow reversed. Binary numbers with a set number of bits, generated by a program in the computer, are fed to the D/A chip at a set rate (called the conversion rate) which then converts them to a sequence of analogue voltages that together comprise a signal.
The limitations of D/A converters are entirely analogous to those of A/D converters. The D/A will have a maximum conversion rate, which means that there is a maximum frequency that can be generated in the output signal. Specifically, according to the Nyquist criterion, the maximum frequency will be half the conversion rate. The USB-6211 has a maximum conversion rate of 250,000Hz, and thus can output signals with frequencies up to 125kHz. The D/A also has a maximum range of voltages it can put out (-10 to 10V in the case of the USB-6211), and a resolution defined by the number of bits in the binary numbers used to define the voltages (16 bits for the 6211). The smallest change in voltage that can be output by our DAQ device is thus 20/216=0.3mV.
D/A converters are not generally provided with output amplifiers (that's just the way it is), and there is no D/A equivalent of the multiplexer that would expand the output signal to many channels. Instead you need one complete D/A chip for every output signal you want to create. The USB 6211 has 2.